
Thread Dumps
Busy Executive Summary
Thread dumps are one of the most effective tools you can use towards resolution of a production software outage.
First you take three successive thread dumps with five second pause.
You can quickly develop a reasonable picture of your application by reviewing the thread activity in these dumps.
Search the thread dumps for your java code package name to find threads specific to your own application code, like ‘com.company.’
Next review any threads with state BLOCKED, RUNNING, and WAITING. Start with the BLOCKED threads. What are they blocking on?
The most typical problems to look for:
- Waiting in JDBC network driver code for a query result.
- Slow threads writing or reading from a disk drive.
- The CPU being exhausted by a section of code.
By taking thread dumps and reviewing the output of a few of them you can quickly pinpoint most production problems.
This article teaches you how to take thread dumps and use them efficiently during an outage.
Reading thread dumps is a critical skill during production outages!
Anatomy of a thread
Each thread in any software system has an instruction it is running. The calls which led to this instruction running are the “call stack.”
Next we will examine the threads from the threading example in the examples code associated with this blog, which can be found here:
Threading Java Class: ThreadingExample.java
You can safely clone and run this example main method from ThreadingExample.java on your desktop or development server.
The sample program starts and runs two threads
and continues the main thread of execution.
All three threads use
while(true) loops which never exit, running forever.
Later we will examine this specific programs threads.
What is a thread dump?
A thread dump instructs the software system to log information regarding every thread of execution in the system. The most valuable piece of information returned is knowing exactly which line in the code every thread is running, which is the top of each call stack returned.
The complete call stack is the entire chain of calls through the software system which led to the line of code being run in each thread. Java makes these easy to read, and provides two summary lines above this important thread information. Any thread has a “state” which it is in. Java reports these states for example, RUNNABLE, WAITING, TIMED_WAITING (“sleep”), and a few others. The thread name and other key thread statistics are also listed by the JVM when a thread dump is generated.
Examples of a Java thread dump
For the “Threading Example” linked above, here is a thread dump generated on my linux machine.
We observe a thread named “fastWorkerA” is RUNNABLE and running source code line 34 of ThreadingExample.java.
"fastWorkerA" #14 prio=5 os_prio=0 cpu=54071.49ms elapsed=54.12s tid=0x00007f6b2c301800 nid=0x306e runnable  [0x00007f6b001e5000]
java.lang.Thread.State: RUNNABLE
at org.example.ThreadingExample$FastWorker.run(ThreadingExample.java:34)
at java.lang.Thread.run(java.base@11.0.16/Thread.java:829)
Line 34 in the sample java program is testing if a counter has exceeded “MAX_VALUE” (as seen in the example code.)
When we take more thread dumps, fastWorkerA is almost always on this specific line.
This line is always active because it takes the most CPU time in the sample program; testing the counter is the slowest line executed in every loop.
This short but significant comparison CPU time means if you repeat the exercise, your thread dump will (almost certainly) be on the same exact line.
if (counter == Integer.MAX_VALUE) {
VisualVM display of a thread dump
What is VisualVM ?
VisualVM is a free user interface for reviewing JVM state.
Installing VisualVM
On Linux Mint and Ubuntu systems, you can install visualvm with apt-get.
sudo apt-get install visualvm
As a Java engineer, you must have a high degree of comfort with VisualVM.
VisualVM is itself a Java program written in Swing.
VisualVM is trivial to download, run and use.
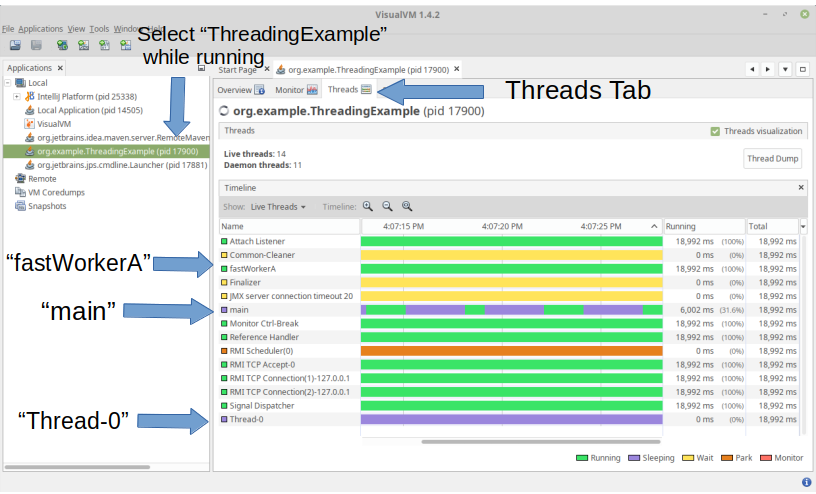
VisualVM Threading Display Tab
VisualVM has a tab to display the threads in the JVM. The tab is named “Threads”. (“Overview” is the first tab you see when you start VisualVM.)
This “Threads” tab, shows the VisualVM thread information while threads are running.
Visual VM interrogates the state of the threads once every second using JMX (Java Management Extensions) Using the information from the JMX calls, VisualVM creates this bar chart of the Java threads.
Reviewing the bar chart is a good place to begin understanding the threading information provided by the JVM.
VisualVM retrieves this information by polling using JMX; however, the same exact information is presented in a thread dump of the JVM.
Later we review the thread dump itself to see the same information is available, and more.
What threads are running?
Two types of threads run in the JVM. Application threads are threads the application itself is running, which is your code you have written. The other threads running are JVM internal threads.
The ThreadingExample.java program has three application threads running.
(1) The “main” thread
The first application thread is “main”, which is the convention the JVM uses for the main method which is kicked off when you start the program. The name is always “main”. The name of this thread can not be changed by Java programmers.
The main thread of our ThreadingExample.java starts two application threads.
(2) The “Thread-0” thread
To show an example of what not to do, ThreadingExample.java creates an unnamed application thread. While you would expect in professional software development, all threads would be named, it is not well understood as a rule of programming, and the JVM unfortunately does not require a name for each thread.
Here on line 48 of ThreadingExample.java, the unnamed thread is created by using the single argument constructor.
Thread threadA = new Thread(slowWorker);
If you do not give a thread a name when it is started the JVM generates a default name for the thread, by using a counter, and names it: “Thread-0.”
There is a static counter in the JVM, which simply counts upwards any time an unnamed thread is started.
(3) The “fastWorkerA” thread
The second application thread is created in ThreadingExample.java and given a name by using the Java constructor with three arguments, the third one being the name.
On line 56 we create the thread to run ‘fastWorker’ and name it fastWorkerA
Thread threadB = new Thread(null, fastWorker, "fastWorkerA");
Review the threads in VisualVM
We can see the third row in the VisualVM thread output shows “fastWorkerA”, as a green bar. The green bar means the thread is in RUNNING state.
Two rows are highlighted purple in the VisualVM tab, the 6th and 13th rows in the “Threads” window.
Main thread
The first purple and green row is “main”.
Purple means sleeping thread state in VisualVM.
This means the main thread was sleeping when I took the screenshot.
The bar chart displays the thread state for the prior 20 seconds.
The “main” thread counts to one billion (RUNNING state) and then sleeps for three seconds (TIMED_WAIT state, sleeping.) This is why the main bar in the chart has blocks of purple followed by shorter green blocks.
The purple blocks in the “main” bar reflect these three second sleeps. The shorter green blocks on the “main” thread bar shows where the main thread woke up and was counting to a billion, taking about a second.
Slow worker thread
The second purple row is running “slowWorker”, the unnamed “Thread-0” which was the first thread kicked off by the ThreadingExample.java program. The SlowWorker code only wakes up briefly, compared to the amount of time spent sleeping. Because the JVM polls JMX and finds the thread to always be sleeping, the entire bar shows purple as sleeping state, as well as the current state which is also sleeping. The state of the threads is actually “TIMED_WAIT”, which VisualVM displays as sleeping.
Power of JVM instrumentation
We can see the JVM provides detailed information regarding internal state of the JVM and the threads running within it.
The advantage of using Java as a server side software language can not be understated.
There has never been a language with this much power while at the same time easy to author, with similar wealth of instrumentation.
The instrumentation is one of the major advantages of the JVM over competing languages. While others offer similar, none are as elegant or powerful as the JVM today still in 2023. This same power has existed in the JVM almost exactly as it does today, since the late 1990s.
Java Thread Dump: Full review
Entire thread dump output, followed by discussion
Next let us review the complete thread dump output for this three thread java program “ThreadingExample.java”.
You may take a thread dump by starting VisualVM, and pressing the “Thread dump” button on the Threads Tab above.
Easier than starting VisualVM is to issue the QUIT signal to the JVM. The JVM is written to produce a Thread Dump to the standard out stream (typically on the console) when it receives a QUIT signal from the Operating System.
On Linux, the way to issue a QUIT signal to a process is to send the signal via the kill command.
e.g.
kill -QUIT <pid>
To do this, first you must obtain the process id, to pass to the
kill command above as ‘
ps -ef | grep java
Once you take the thread dump, it will output to the console of your program. If you are using logback this output may be piped to your log file. For Tomcat is will be directed to the catalina.out log file.
As you review the thread dump, you can note a few things. This is merely a text output which is what VisualVM uses to produce the “Threads” GUI tab.
There are 13 threads in total; three are application threads from our own ThreadingExample.java, and the other ten are JVM threads we do not control, started by the JVM itself. These JVM threads are for garbage collection and connecting to the JVM, for example as we have done for VisualVM.
We will also see our three application threads:
- main
- fastWorkerA
- Thread-0
These are intertwined with the 10 JVM threads without a strong ordering.
Each thread dump block begins with the name of the thread in quotes, and we can see “main” is the first thread dumped to output.
Search from here for org.example as if this is the primary package for your company.
You will observe three threads below, which are the main and the two threads kicked off by main.
2023-01-01 13:27:32
Full thread dump OpenJDK 64-Bit Server VM (11.0.16+8-post-Ubuntu-0ubuntu118.04 mixed mode, sharing):

Threads class SMR info:
_java_thread_list=0x00007f6ac80089a0, length=18, elements={
0x00007f6b2c018800, 0x00007f6b2c234000, 0x00007f6b2c236000, 0x00007f6b2c23b800,
0x00007f6b2c23d800, 0x00007f6b2c23f800, 0x00007f6b2c241800, 0x00007f6b2c243800,
0x00007f6b2c261800, 0x00007f6b2c2fc000, 0x00007f6b2c2ff800, 0x00007f6b2c301800,
0x00007f6ae0001000, 0x00007f6ab40fb800, 0x00007f6ac8005800, 0x00007f6aac07f000,
0x00007f6aac086000, 0x00007f6ac8007000
}

"main" #1 prio=5 os_prio=0 cpu=120.01ms elapsed=54.23s tid=0x00007f6b2c018800 nid=0x305b waiting on condition  [0x00007f6b361d4000]
java.lang.Thread.State: TIMED_WAITING (sleeping)
at java.lang.Thread.sleep(java.base@11.0.16/Native Method)
at org.example.ThreadingExample.main(ThreadingExample.java:66)

Locked ownable synchronizers:
- None

"Reference Handler" #2 daemon prio=10 os_prio=0 cpu=0.17ms elapsed=54.22s tid=0x00007f6b2c234000 nid=0x3062 waiting on condition  [0x00007f6b014f8000]
java.lang.Thread.State: RUNNABLE
at java.lang.ref.Reference.waitForReferencePendingList(java.base@11.0.16/Native Method)
at java.lang.ref.Reference.processPendingReferences(java.base@11.0.16/Reference.java:241)
at java.lang.ref.Reference$ReferenceHandler.run(java.base@11.0.16/Reference.java:213)

Locked ownable synchronizers:
- None

"Finalizer" #3 daemon prio=8 os_prio=0 cpu=0.28ms elapsed=54.22s tid=0x00007f6b2c236000 nid=0x3063 in Object.wait()  [0x00007f6b013f7000]
java.lang.Thread.State: WAITING (on object monitor)
at java.lang.Object.wait(java.base@11.0.16/Native Method)
- waiting on <0x00000007195024e8> (a java.lang.ref.ReferenceQueue$Lock)
  at java.lang.ref.ReferenceQueue.remove(java.base@11.0.16/ReferenceQueue.java:155)
- waiting to re-lock in wait() <0x00000007195024e8> (a java.lang.ref.ReferenceQueue$Lock)
  at java.lang.ref.ReferenceQueue.remove(java.base@11.0.16/ReferenceQueue.java:176)
  at java.lang.ref.Finalizer$FinalizerThread.run(java.base@11.0.16/Finalizer.java:170)

Locked ownable synchronizers:
- None

"Signal Dispatcher" #4 daemon prio=9 os_prio=0 cpu=0.35ms elapsed=54.22s tid=0x00007f6b2c23b800 nid=0x3064 runnable  [0x0000000000000000]
java.lang.Thread.State: RUNNABLE

Locked ownable synchronizers:
- None

"Service Thread" #5 daemon prio=9 os_prio=0 cpu=0.06ms elapsed=54.21s tid=0x00007f6b2c23d800 nid=0x3065 runnable  [0x0000000000000000]
java.lang.Thread.State: RUNNABLE

Locked ownable synchronizers:
- None

"C2 CompilerThread0" #6 daemon prio=9 os_prio=0 cpu=817.05ms elapsed=54.21s tid=0x00007f6b2c23f800 nid=0x3066 waiting on condition  [0x0000000000000000]
java.lang.Thread.State: RUNNABLE
No compile task

Locked ownable synchronizers:
- None

"C1 CompilerThread0" #9 daemon prio=9 os_prio=0 cpu=483.65ms elapsed=54.21s tid=0x00007f6b2c241800 nid=0x3067 waiting on condition  [0x0000000000000000]
java.lang.Thread.State: RUNNABLE
No compile task

Locked ownable synchronizers:
- None

"Sweeper thread" #10 daemon prio=9 os_prio=0 cpu=0.11ms elapsed=54.21s tid=0x00007f6b2c243800 nid=0x3068 runnable  [0x0000000000000000]
java.lang.Thread.State: RUNNABLE

Locked ownable synchronizers:
- None

"Common-Cleaner" #11 daemon prio=8 os_prio=0 cpu=0.18ms elapsed=54.18s tid=0x00007f6b2c261800 nid=0x3069 in Object.wait()  [0x00007f6b00b13000]
java.lang.Thread.State: TIMED_WAITING (on object monitor)
at java.lang.Object.wait(java.base@11.0.16/Native Method)
- waiting on <0x0000000719546188> (a java.lang.ref.ReferenceQueue$Lock)
  at java.lang.ref.ReferenceQueue.remove(java.base@11.0.16/ReferenceQueue.java:155)
- waiting to re-lock in wait() <0x0000000719546188> (a java.lang.ref.ReferenceQueue$Lock)
  at jdk.internal.ref.CleanerImpl.run(java.base@11.0.16/CleanerImpl.java:148)
  at java.lang.Thread.run(java.base@11.0.16/Thread.java:829)
  at jdk.internal.misc.InnocuousThread.run(java.base@11.0.16/InnocuousThread.java:161)

Locked ownable synchronizers:
- None

"Monitor Ctrl-Break" #12 daemon prio=5 os_prio=0 cpu=10.47ms elapsed=54.12s tid=0x00007f6b2c2fc000 nid=0x306b runnable  [0x00007f6b004ea000]
java.lang.Thread.State: RUNNABLE
at java.net.SocketInputStream.socketRead0(java.base@11.0.16/Native Method)
at java.net.SocketInputStream.socketRead(java.base@11.0.16/SocketInputStream.java:115)
at java.net.SocketInputStream.read(java.base@11.0.16/SocketInputStream.java:168)
at java.net.SocketInputStream.read(java.base@11.0.16/SocketInputStream.java:140)
at sun.nio.cs.StreamDecoder.readBytes(java.base@11.0.16/StreamDecoder.java:284)
at sun.nio.cs.StreamDecoder.implRead(java.base@11.0.16/StreamDecoder.java:326)
at sun.nio.cs.StreamDecoder.read(java.base@11.0.16/StreamDecoder.java:178)
- locked <0x000000071938c4e0> (a java.io.InputStreamReader)
  at java.io.InputStreamReader.read(java.base@11.0.16/InputStreamReader.java:181)
  at java.io.BufferedReader.fill(java.base@11.0.16/BufferedReader.java:161)
  at java.io.BufferedReader.readLine(java.base@11.0.16/BufferedReader.java:326)
- locked <0x000000071938c4e0> (a java.io.InputStreamReader)
  at java.io.BufferedReader.readLine(java.base@11.0.16/BufferedReader.java:392)
  at com.intellij.rt.execution.application.AppMainV2$1.run(AppMainV2.java:47)

Locked ownable synchronizers:
- None

"Thread-0" #13 prio=5 os_prio=0 cpu=19.85ms elapsed=54.12s tid=0x00007f6b2c2ff800 nid=0x306d waiting on condition  [0x00007f6b002e7000]
java.lang.Thread.State: TIMED_WAITING (sleeping)
at java.lang.Thread.sleep(java.base@11.0.16/Native Method)
at org.example.ThreadingExample$SlowWorker.run(ThreadingExample.java:13)
at java.lang.Thread.run(java.base@11.0.16/Thread.java:829)

Locked ownable synchronizers:
- None

"fastWorkerA" #14 prio=5 os_prio=0 cpu=54071.49ms elapsed=54.12s tid=0x00007f6b2c301800 nid=0x306e runnable  [0x00007f6b001e5000]
java.lang.Thread.State: RUNNABLE
at org.example.ThreadingExample$FastWorker.run(ThreadingExample.java:34)
at java.lang.Thread.run(java.base@11.0.16/Thread.java:829)

Locked ownable synchronizers:
- None

"Attach Listener" #15 daemon prio=9 os_prio=0 cpu=236.16ms elapsed=53.17s tid=0x00007f6ae0001000 nid=0x3080 waiting on condition  [0x0000000000000000]
java.lang.Thread.State: RUNNABLE

Locked ownable synchronizers:
- None

"RMI TCP Accept-0" #17 daemon prio=9 os_prio=0 cpu=1.40ms elapsed=44.07s tid=0x00007f6ab40fb800 nid=0x30f2 runnable  [0x00007f6b00a12000]
java.lang.Thread.State: RUNNABLE
at java.net.PlainSocketImpl.socketAccept(java.base@11.0.16/Native Method)
at java.net.AbstractPlainSocketImpl.accept(java.base@11.0.16/AbstractPlainSocketImpl.java:474)
at java.net.ServerSocket.implAccept(java.base@11.0.16/ServerSocket.java:565)
at java.net.ServerSocket.accept(java.base@11.0.16/ServerSocket.java:533)
at sun.management.jmxremote.LocalRMIServerSocketFactory$1.accept(jdk.management.agent@11.0.16/LocalRMIServerSocketFactory.java:52)
at sun.rmi.transport.tcp.TCPTransport$AcceptLoop.executeAcceptLoop(java.rmi@11.0.16/TCPTransport.java:394)
at sun.rmi.transport.tcp.TCPTransport$AcceptLoop.run(java.rmi@11.0.16/TCPTransport.java:366)
at java.lang.Thread.run(java.base@11.0.16/Thread.java:829)

Locked ownable synchronizers:
- None

"RMI TCP Connection(1)-127.0.0.1" #18 daemon prio=9 os_prio=0 cpu=197.56ms elapsed=44.06s tid=0x00007f6ac8005800 nid=0x30f4 runnable  [0x00007f6abf8ec000]
java.lang.Thread.State: RUNNABLE
at java.net.SocketInputStream.socketRead0(java.base@11.0.16/Native Method)
at java.net.SocketInputStream.socketRead(java.base@11.0.16/SocketInputStream.java:115)
at java.net.SocketInputStream.read(java.base@11.0.16/SocketInputStream.java:168)
at java.net.SocketInputStream.read(java.base@11.0.16/SocketInputStream.java:140)
at java.io.BufferedInputStream.fill(java.base@11.0.16/BufferedInputStream.java:252)
at java.io.BufferedInputStream.read(java.base@11.0.16/BufferedInputStream.java:271)
- locked <0x0000000718c5ff48> (a java.io.BufferedInputStream)
  at java.io.FilterInputStream.read(java.base@11.0.16/FilterInputStream.java:83)
  at sun.rmi.transport.tcp.TCPTransport.handleMessages(java.rmi@11.0.16/TCPTransport.java:544)
  at sun.rmi.transport.tcp.TCPTransport$ConnectionHandler.run0(java.rmi@11.0.16/TCPTransport.java:796)
  at sun.rmi.transport.tcp.TCPTransport$ConnectionHandler.lambda$run$0(java.rmi@11.0.16/TCPTransport.java:677)
  at sun.rmi.transport.tcp.TCPTransport$ConnectionHandler$$Lambda$90/0x00000008400bc440.run(java.rmi@11.0.16/Unknown Source)
  at java.security.AccessController.doPrivileged(java.base@11.0.16/Native Method)
  at sun.rmi.transport.tcp.TCPTransport$ConnectionHandler.run(java.rmi@11.0.16/TCPTransport.java:676)
  at java.util.concurrent.ThreadPoolExecutor.runWorker(java.base@11.0.16/ThreadPoolExecutor.java:1128)
  at java.util.concurrent.ThreadPoolExecutor$Worker.run(java.base@11.0.16/ThreadPoolExecutor.java:628)
  at java.lang.Thread.run(java.base@11.0.16/Thread.java:829)

Locked ownable synchronizers:
- <0x0000000718df69c8> (a java.util.concurrent.ThreadPoolExecutor$Worker)

"RMI Scheduler(0)" #19 daemon prio=9 os_prio=0 cpu=1.24ms elapsed=44.03s tid=0x00007f6aac07f000 nid=0x30f5 waiting on condition  [0x00007f6abf7ed000]
java.lang.Thread.State: TIMED_WAITING (parking)
at jdk.internal.misc.Unsafe.park(java.base@11.0.16/Native Method)
- parking to wait for  <0x0000000718d80d08> (a java.util.concurrent.locks.AbstractQueuedSynchronizer$ConditionObject)
  at java.util.concurrent.locks.LockSupport.parkNanos(java.base@11.0.16/LockSupport.java:234)
  at java.util.concurrent.locks.AbstractQueuedSynchronizer$ConditionObject.awaitNanos(java.base@11.0.16/AbstractQueuedSynchronizer.java:2123)
  at java.util.concurrent.ScheduledThreadPoolExecutor$DelayedWorkQueue.take(java.base@11.0.16/ScheduledThreadPoolExecutor.java:1182)
  at java.util.concurrent.ScheduledThreadPoolExecutor$DelayedWorkQueue.take(java.base@11.0.16/ScheduledThreadPoolExecutor.java:899)
  at java.util.concurrent.ThreadPoolExecutor.getTask(java.base@11.0.16/ThreadPoolExecutor.java:1054)
  at java.util.concurrent.ThreadPoolExecutor.runWorker(java.base@11.0.16/ThreadPoolExecutor.java:1114)
  at java.util.concurrent.ThreadPoolExecutor$Worker.run(java.base@11.0.16/ThreadPoolExecutor.java:628)
  at java.lang.Thread.run(java.base@11.0.16/Thread.java:829)

Locked ownable synchronizers:
- None

"JMX server connection timeout 20" #20 daemon prio=9 os_prio=0 cpu=13.83ms elapsed=44.02s tid=0x00007f6aac086000 nid=0x30f6 in Object.wait()  [0x00007f6abf6ec000]
java.lang.Thread.State: TIMED_WAITING (on object monitor)
at java.lang.Object.wait(java.base@11.0.16/Native Method)
- waiting on <0x0000000718ccded0> (a [I)
  at com.sun.jmx.remote.internal.ServerCommunicatorAdmin$Timeout.run(java.management@11.0.16/ServerCommunicatorAdmin.java:171)
- waiting to re-lock in wait() <0x0000000718ccded0> (a [I)
  at java.lang.Thread.run(java.base@11.0.16/Thread.java:829)

Locked ownable synchronizers:
- None

"RMI TCP Connection(2)-127.0.0.1" #21 daemon prio=9 os_prio=0 cpu=72.85ms elapsed=42.97s tid=0x00007f6ac8007000 nid=0x3102 runnable  [0x00007f6abf5e9000]
java.lang.Thread.State: RUNNABLE
at java.net.SocketInputStream.socketRead0(java.base@11.0.16/Native Method)
at java.net.SocketInputStream.socketRead(java.base@11.0.16/SocketInputStream.java:115)
at java.net.SocketInputStream.read(java.base@11.0.16/SocketInputStream.java:168)
at java.net.SocketInputStream.read(java.base@11.0.16/SocketInputStream.java:140)
at java.io.BufferedInputStream.fill(java.base@11.0.16/BufferedInputStream.java:252)
at java.io.BufferedInputStream.read(java.base@11.0.16/BufferedInputStream.java:271)
- locked <0x0000000718af66b0> (a java.io.BufferedInputStream)
  at java.io.FilterInputStream.read(java.base@11.0.16/FilterInputStream.java:83)
  at sun.rmi.transport.tcp.TCPTransport.handleMessages(java.rmi@11.0.16/TCPTransport.java:544)
  at sun.rmi.transport.tcp.TCPTransport$ConnectionHandler.run0(java.rmi@11.0.16/TCPTransport.java:796)
  at sun.rmi.transport.tcp.TCPTransport$ConnectionHandler.lambda$run$0(java.rmi@11.0.16/TCPTransport.java:677)
  at sun.rmi.transport.tcp.TCPTransport$ConnectionHandler$$Lambda$90/0x00000008400bc440.run(java.rmi@11.0.16/Unknown Source)
  at java.security.AccessController.doPrivileged(java.base@11.0.16/Native Method)
  at sun.rmi.transport.tcp.TCPTransport$ConnectionHandler.run(java.rmi@11.0.16/TCPTransport.java:676)
  at java.util.concurrent.ThreadPoolExecutor.runWorker(java.base@11.0.16/ThreadPoolExecutor.java:1128)
  at java.util.concurrent.ThreadPoolExecutor$Worker.run(java.base@11.0.16/ThreadPoolExecutor.java:628)
  at java.lang.Thread.run(java.base@11.0.16/Thread.java:829)

Locked ownable synchronizers:
- <0x0000000718df7150> (a java.util.concurrent.ThreadPoolExecutor$Worker)

"VM Thread" os_prio=0 cpu=36.33ms elapsed=54.23s tid=0x00007f6b2c231000 nid=0x3061 runnable

"GC Thread#0" os_prio=0 cpu=4.77ms elapsed=54.23s tid=0x00007f6b2c031000 nid=0x305c runnable

"G1 Main Marker" os_prio=0 cpu=0.26ms elapsed=54.23s tid=0x00007f6b2c08e000 nid=0x305d runnable

"G1 Conc#0" os_prio=0 cpu=0.05ms elapsed=54.23s tid=0x00007f6b2c090000 nid=0x305e runnable

"G1 Refine#0" os_prio=0 cpu=0.24ms elapsed=54.23s tid=0x00007f6b2c18c800 nid=0x305f runnable

"G1 Young RemSet Sampling" os_prio=0 cpu=4.25ms elapsed=54.23s tid=0x00007f6b2c18e000 nid=0x3060 runnable
"VM Periodic Task Thread" os_prio=0 cpu=16.41ms elapsed=54.12s tid=0x00007f6b2c2fd800 nid=0x306c waiting on condition

JNI global refs: 17, weak refs: 0
Information gleaned from a thread dump
While it seems like an overwhelming amount of information it is not difficult to find your particular application code and isolate it from the other JVM system threads.
Are your application threads alive?
If you name your threads, it is trivial to check if those threads have exited, by grepping for their thread name in the thread dump. If the threads are not listed, then they have exited.
Without naming every thread, other approaches must be used,
which can be error-prone during an emergency.
You can for example look for lines of code which
must be in the stack for a particular thread to be running.
But at this point you must be able to draw (correct) observations once
removed through inference.
Furthermore, you must have the exact release of the code checked out and be reviewing this exact commit. During an emergency this can be challenging and is additional wasted time. You can avoid this difficulty by simply naming all your threads.
Example ‘from the field’
One example from the field is when a java.lang.StackOverflowException was thrown, in ANTLR generated code. This happened to our team in production once, causing a major outage.
Whenever a particularly large message with more than 5,000 nested ANTLR expressions in the expression tree arrived, the thread for reading and processing new messages exited with this exception. The java stack for each thread is about 10,000 in size, and each ANTLR call adds two calls to the call stack, building a recursive expression tree using the Java stack. This exceeded the Java stack size, and the JVM threw the java.lang.StackOverflowException. It is not an exception you often see unless you code recursion with an incorrect base case, which was not the problem here. It was indeed, correct code which happened to exceed the extremely large, default Java stack size.
This thread which exited was also not named.
Therefore, we had to infer from the code itself and by reviewing certain methods and line numbers, that this thread had exited, which we did.
Catch Unchecked Exception when kicking off threads
Still, we could not know for sure, but decided it must have been an unchecked exception.
Since the thread processing the messages only checked for caught exceptions, which allowed one message to throw an exception which was uncaught. This caused the thread to exit, without so much as logging the uncaught exception.
Two more important take-aways exist from this example. Code which starts a thread, must always be surrounded by try-catch-exception-finally blocks, particularly the finally block. In the finally block, you should always note that the particularly named thread is exiting. This way in your logs, you can be certain the thread stopped, and know exactly when it stopped.
Second, the catch block must
always catch unchecked exceptions (java.lang.Exception should be caught.)
This advice contradicts much writing and “conventional wisdom.”
For example, InfoWorld tip 134
talks about reasons to not catch
uncaught exceptions, and mentions, “perhaps in
general error handling you could do this, but only then.”
This is too weak a statement.
Instead, you must always
name your threads when you start them, and log them
if they exit abnormally by catching java.lang.Exception
where the thread was started.
This may be called code bloat; however, this is a trade-off.
I strongly recommend trading off observability as it can be critical for your business success. From a cost/value perspective, you are trading a fat tailed distribution of time lost debugging, vs. a tiny fixed cost of reading the try-catch block. Meaning, if once in your life, you spend three hours debugging, looking for a dead thread which may have died without any logging of the thread death, you have already lost more time than you would have spent in several lifetimes, reading the try-catch block. If you structure your code, the try catch could be a standard annotation, which you write once, and costs almost nothing as a “code reading concern.”
Recounting this example also makes me think ANTLR should force
developers to catch a specific sub-class itself of
java.lang.StackOverflowError.
This rare problem happens only
in generated code and is not something you would expect
to happen or would reasonably unit test, yet it
is not too difficult to occur
“in the field” with a large expression.
Summary
Writing a few lines around any code which starts threads, and catching and logging if they exit, can someday save you hours of confusion during an outage, despite the overhead in code bloat.
What state are your threads in?
As seen from the “main” thread in ThreadingExample.java it is easy to see on the VisualVM chart which states a thread has been in while you watch it.
This exact information is also in the thread dump.
Key trick [!!!] Solve high CPU utilization outages
To do something similar to VisualVM, you can take multiple thread dumps on the command line, a few seconds apart from each other. Next, you can line up the threads using their names. Using this crude text approach, can tell you what each thread has done and if any state has changed over the time horizon of your taking the snapshots.
This is most useful if there is high CPU. For each thread which is in RUNNING state across more than one or all of the thread dumps, you should first review what the code is doing, and if the code could be in an infinite or long-running and CPU expensive loop without any other IO operations. It is usually very likely that these threads are the cause of high CPU, and you can guess which one of the threads is to blame by reading the code for the threads which are in RUNNING state, to develop a good hypothesis of what code is causing the high CPU. Once you have a hypothesis, you can take many more thread dumps and see if this code remains in the RUNNING state. If it does, then it is very likely the cause of high CPU. From there, you can look at the inputs to the area which is likely high CPU, and see if any recent inputs would result in higher than expected CPU usage of the code you are reviewing. CPU usage outages are one of if not the most challenging outages you can solve. Using this technique of thread dumps, you will be able to solve high CPU situations with relative easy, in a matter of minutes. These same problems without using this specific approach can take days or weeks, or go totally unsolved.
With your enhanced Java knowledge, you can now solve these toughest of all outages in production, and extremely quickly.
2nd ‘from the field’ example: high CPU usage
Pagination code for an authorization system was incapable of handling more than thousands of accounts being associated with a user. The pagniation code would send this message to a downstream system, which would throw a caught exception, resulting in a retry. This retry would be run in a tight loop in pagination code, taking up one entire CPU. Each time one of these request was made, one CPU on one server would go in a tight loop to 100%. With a server farm of for example one hundred machines and 64 cores per machine, it would take 6400 requests before the entire authorization cluster was at 100% CPU, a brownout. This would take some time to occur, as not every request had this unhandled exception. Over a period of tens of minutes the cluster would become unstable. As authorization is at the core of all systems, this kind of defect can be catastrophic.
If you are ready using these techniques, you can be a hero.
APPENDIX
In the Java slim containers, java is always PID 1. Here is how you can send a thread dump into a Docker container. The thread dump will be in the docker logs
# Find the PID of the process you want to kill.
Replace 'process_name' with the actual process name or criteria
docker exec my_container sh -c 'ps aux | grep java'

# Use the PID obtained from the previous step.
# Replace 'PID' with the actual PID
docker exec my_container sh -c 'kill -3 PID' `

# Get the logs with the Thread Dump
docker logs my_container --tail 10000 > jvm_thread.out
VisualVM in Production
VisualVM can be run remotely, from the machine you are working on. This technique can be useful but requires you to configure X-windows which is typically not available on production linux OS builds, because it is considered to make the security on the system marginally weaker. You can enable remote JMX access to your development and QA areas, and connect directly to the JVMs using VisualVM, and this can be useful for debugging and observing the application behavior prior to releasing. Generally you should avoid opening remote JMX connections in production.
How to interpret a thread dump
Follow up - How to read the stack and see where a thread has been in the code?
Follow up - How can you identify a deadlock in your code, and what tool should you try first to show you if you have a deadlock?
Java thread dump tools
Follow up - Review the best tools available for thread dump analysis, and which is recommended.
Threads Basic Review
What is a thread?
We assume readers are well versed in concurrency and threading in software systems. If not, some background may be reviewed here.
Educative.io blog on threading
Quick summary of threading
Everything you run on any software system is done by a thread. The primary thread of any program is the main thread.
You start additional threads other than the main
thread when you
do work in parallel.
Threads usually interact with each other by passing information to other threads using memory.
Languages like Java, C++, Rust and others support threading and will run the software using parallel threads of execution, when asked. The operating system schedules the threads to run using a part of the kernel called a scheduler.
Generally you can run at least as many threads as there are cores on your machine. You are free to start as many threads as you want. Once you exceed the number of cores on your system, the operating system scheduler gives each thread a slice of time to run on a core. When a core becomes avaialable, the operating system code does the heavy lifting of recording where the thread was last running, and then continuing exactly where the thread had bee de-scheduled.